Press
Longstanding is a quiet longevity benchmark for iPhone and Android. You choose what you still want to be able to do at 85, from getting up off the floor with one hand to hiking 5 km with real climbs, then take eleven field tests at 10 stations, about 40 minutes in all, and re-test every quarter. Each result is read against a published table for your age and sex, named with its year and sample size, and against the line you need to be on today to still do those things at 85. Where no table exists, the app says so instead of inventing a percentile. There is no account, no server for your results and no AI.
Facts
- Name
- Longstanding
- Availability
- Coming soon to iPhone and Android. Not yet in either store.
- Price
- The baseline is free and complete: onboarding, all ten stations, and every result read against its source. After the baseline, one payment of $29 unlocks everything that follows. No subscription, no account. Family Sharing is on for the purchase.
- Data
- Stored on the phone. No account, no server for results, no analytics in the app.
- Made by
- An independent developer.
- Website
- marginal-decade.vercel.app
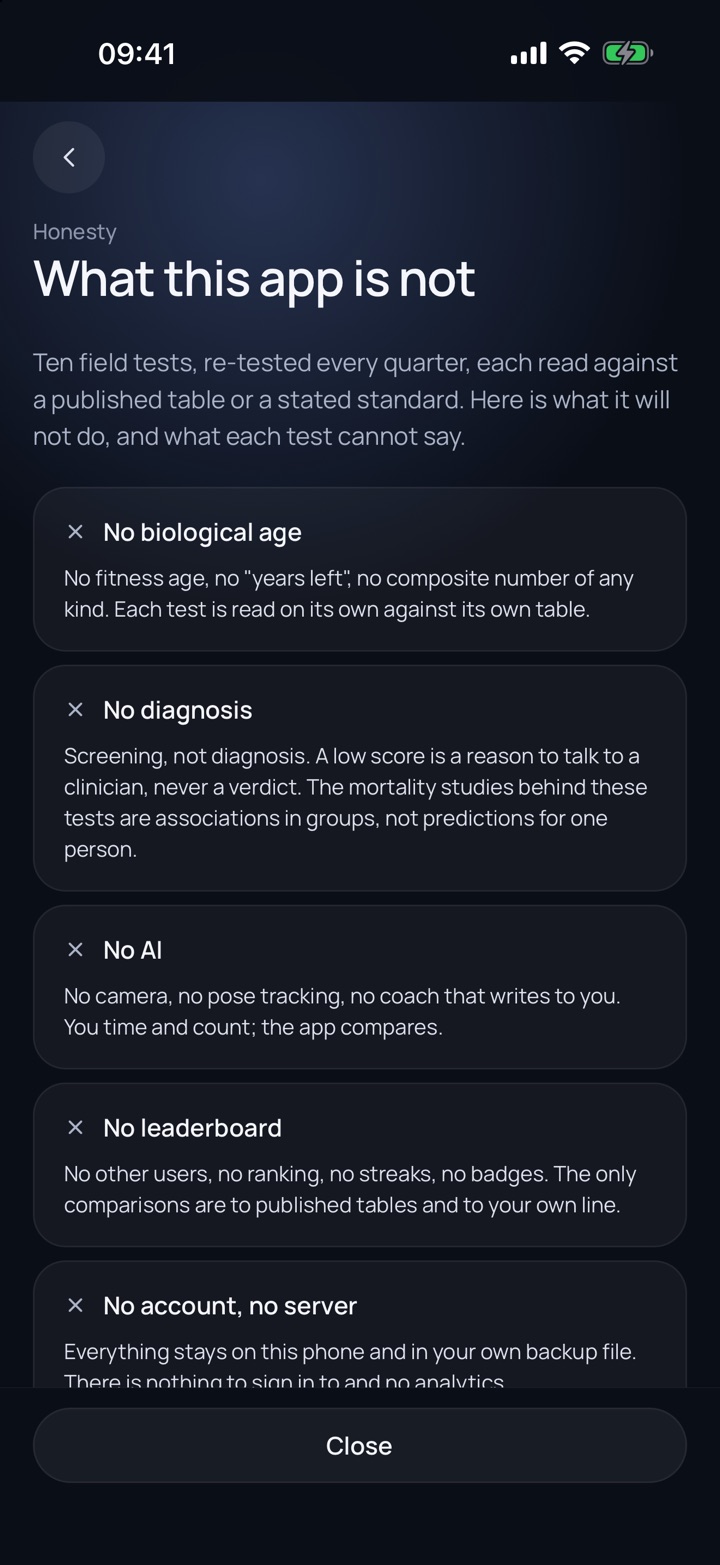
What it is not
- No biological age, no fitness age, no “years left”.
- No diagnosis. Screening, not a verdict.
- No AI, no camera, no pose tracking.
- No leaderboard, no social feed, no streaks.
- No account and no server for your data.
- At most three notifications a quarter.
The full list, with what each test cannot say, is on what this app is not.
Every source the app scores against
The same list the app shows under each result. Each test page adds the protocol, the caveats and the reference lines stated by named people where no table exists.
| Test | Source | Year | Sample | Who was sampled |
|---|---|---|---|---|
| Grip strengthPercentile table | Grip norms from 12 British studies (Dodds) | 2014 | 49,964 | 49,964 people aged 4–90 in 12 British studies; centiles by exact age and sexWomen and men |
| Grip strengthShown for comparison only | US grip norms, NIH Toolbox (Wang) | 2018 | 1,232 | 1,232 US adults, NIH Toolbox; calibrated digital Jamar, seated, elbow at 90°, one squeeze per handWomen and men |
| VO₂maxPercentile table | FRIEND registry treadmill norms (Kaminsky) | 2022 | 16,278 | 16,278 maximal treadmill tests with gas analysis, 34 US laboratories, apparently healthy adults aged 20–89, 1968–2021Women and men |
| 5 × sit-to-standPercentile table | Five-times sit-to-stand meta-analysis (Bohannon) | 2006 | 12,978 | Thirteen papers, 14 studies, adults 60 and over: 4,184 (60–69), 8,450 (70–79), 344 (80–89)Women and men |
| 5 × sit-to-standPercentile table | Sit-to-stand across the age-span (Bohannon) | 2010 | 181 | 181 NIH Toolbox volunteers aged 14–85; 15–36 per decadeWomen and men |
| Single-leg stand · eyes closedPercentile table | Unipedal stance norms (Springer) | 2007 | 549 | 549 screened volunteers aged 18–99 at a US military medical centreWomen and men |
| Single-leg stand · eyes openPercentile table | Unipedal stance norms (Springer) | 2007 | 549 | 549 screened volunteers aged 18–99 at a US military medical centreWomen and men |
| Floor sit-and-risePercentile table | Sitting-rising reference scores (Araújo) | 2020 | 6,141 | 6,141 non-athlete adults (4,101 men, 2,040 women) aged 16–98 at one Rio de Janeiro clinic, 1998–2018Women and men |
| Push-upsTable, read loosely (estimated) | CSEP-PATH push-up categories | 2019 | – | Canadian adults 20–69 by age and sex; sample and year not given in the reprintWomen and men |
| Dead hangNo population table | Lines stated by Galpin | 2023 | – | Standards stated on record; not a sampled populationNot a sampled population |
| Farmer carryNo population table | No norm; tracked as a trend | 2019 | – | 11 biomechanics studies of the farmer’s walk; no norms, no health outcomesNot a sampled population |
| Stair test · 4 flightsTable, read loosely (estimated) | Four-flight stair climb, one clinic (Peteiro) | 2021 | 165 | 165 patients referred for exercise testing (mean age 66, 55% men); 60 stairs at a fast pace without runningWomen and men |
| Waist-to-heightNo population table | Central fatness meta-analysis (Jayedi) | 2020 | 760,190 | 72 cohorts, 2,528,297 participants; waist-to-height ratio in 11 cohorts, 760,190 peopleWomen and men |
| Moderate minutes · about zone 2, per weekGuideline, not a percentile | WHO 2020 activity guideline | 2020 | – | AdultsNot a sampled population |
Screenshots
iPhone captures, 720 × 1565. Open one to save it at full size.
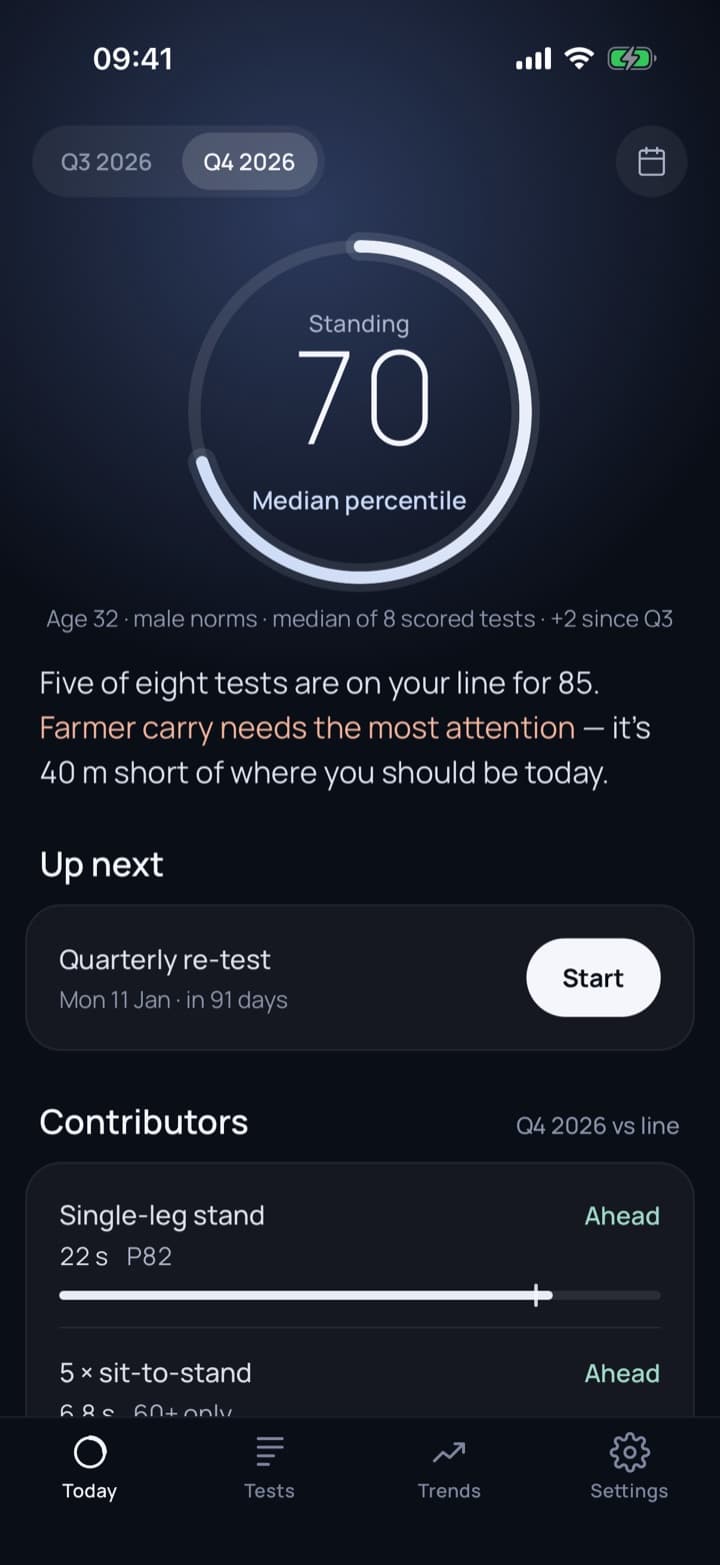
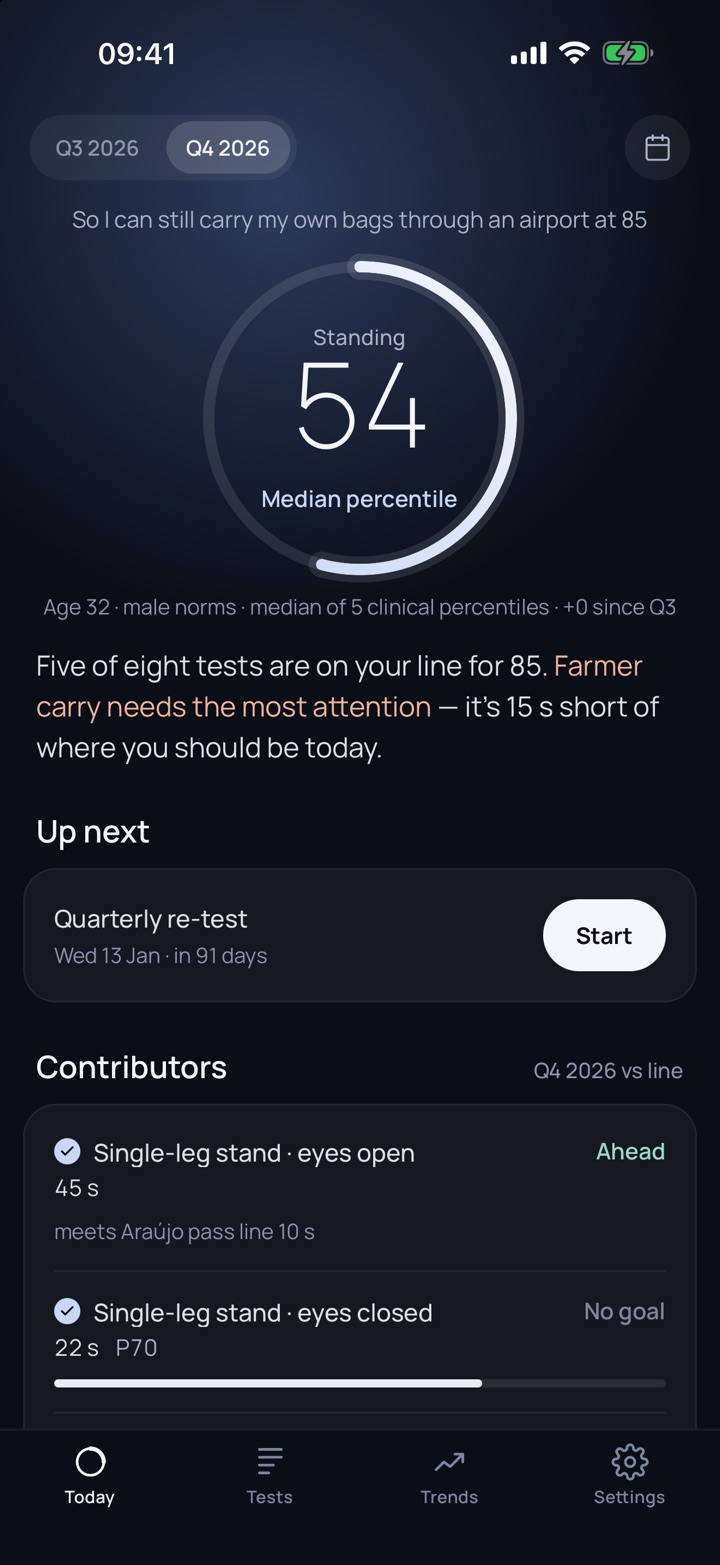
Today
One standing, one sentence, the next re-test.
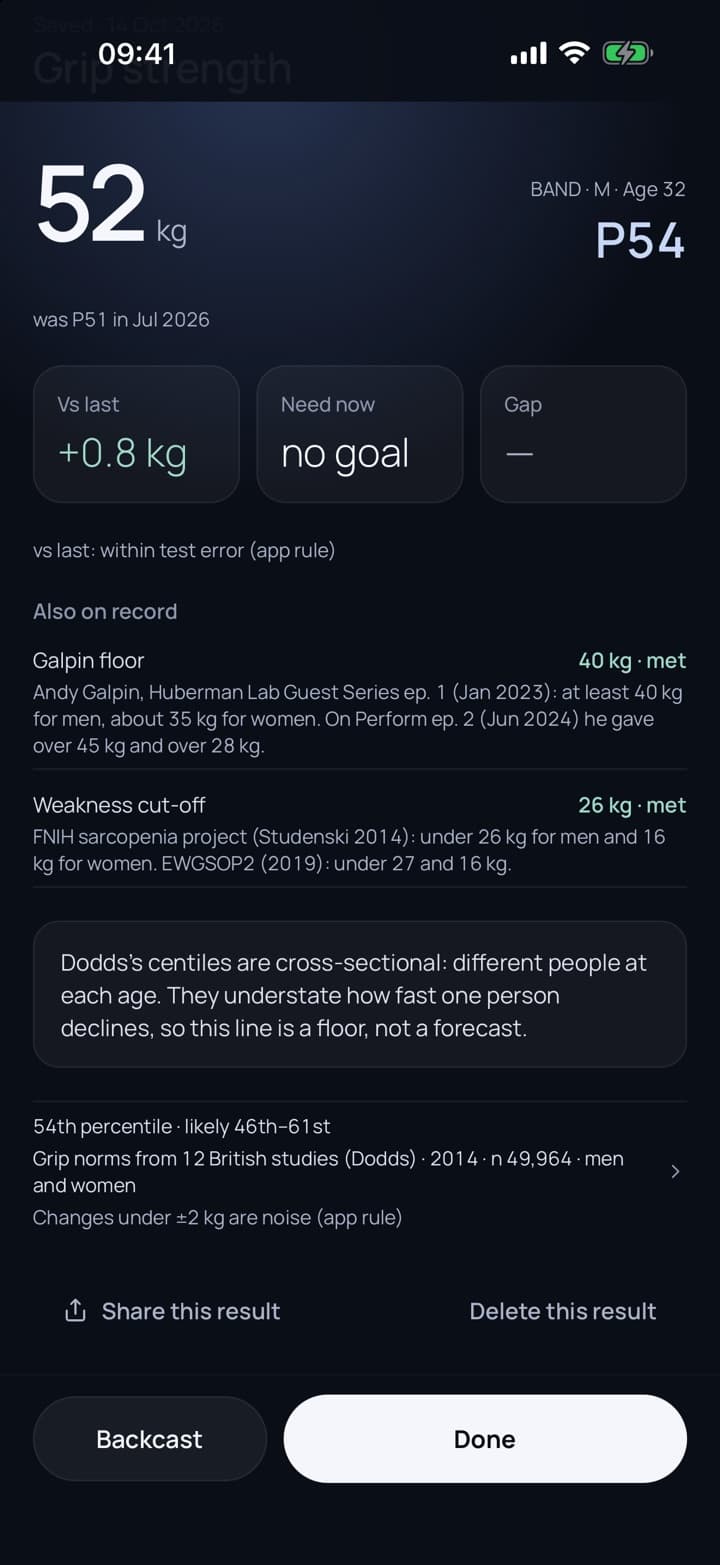
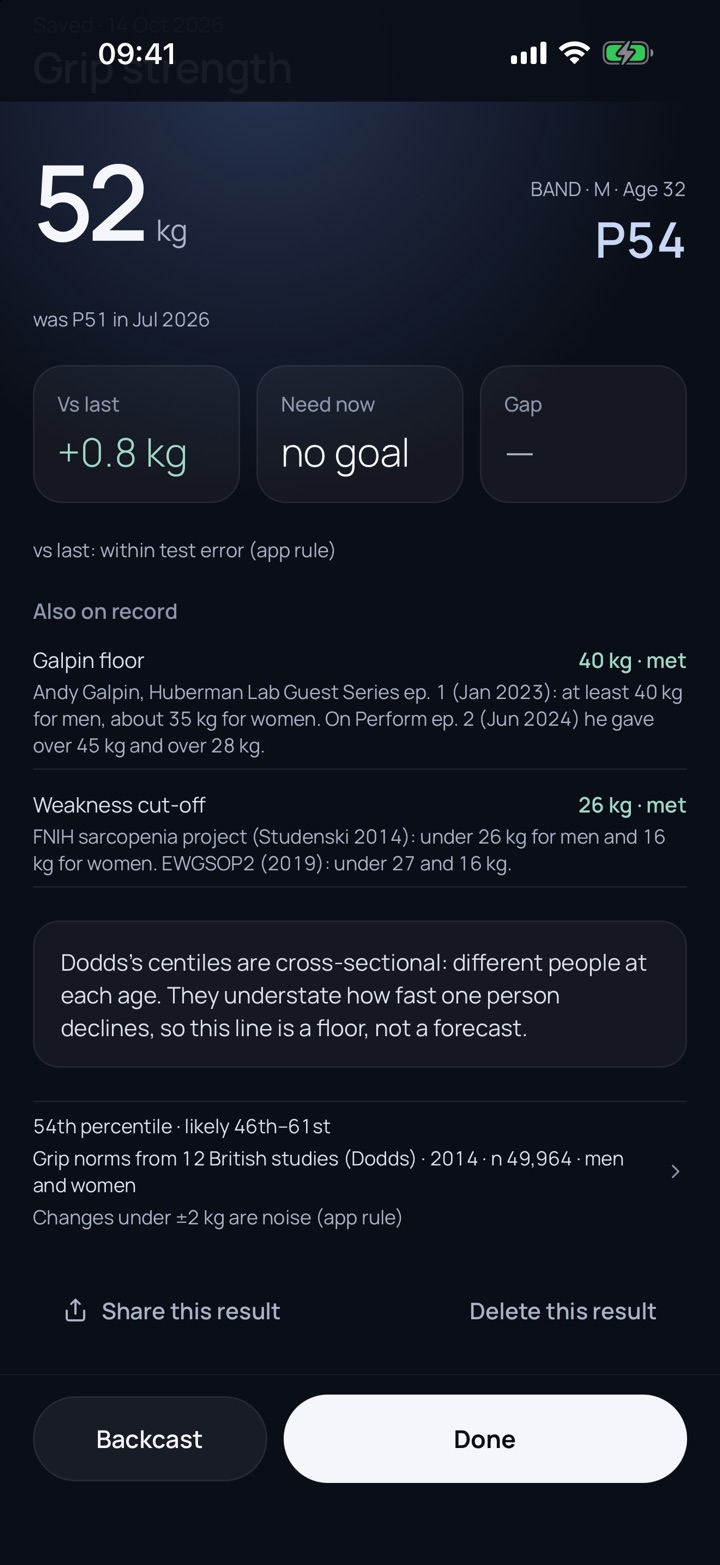
Source line
Every number names its table.
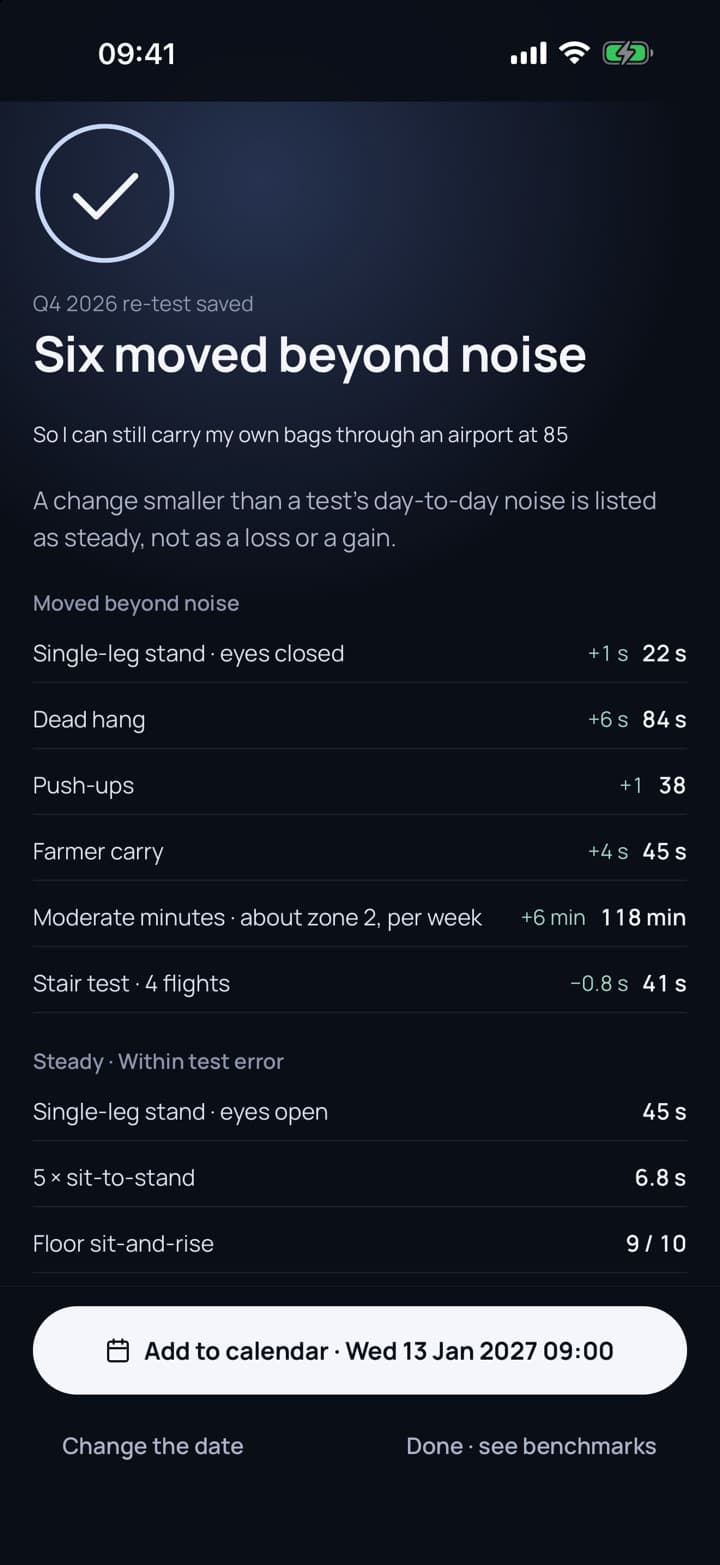
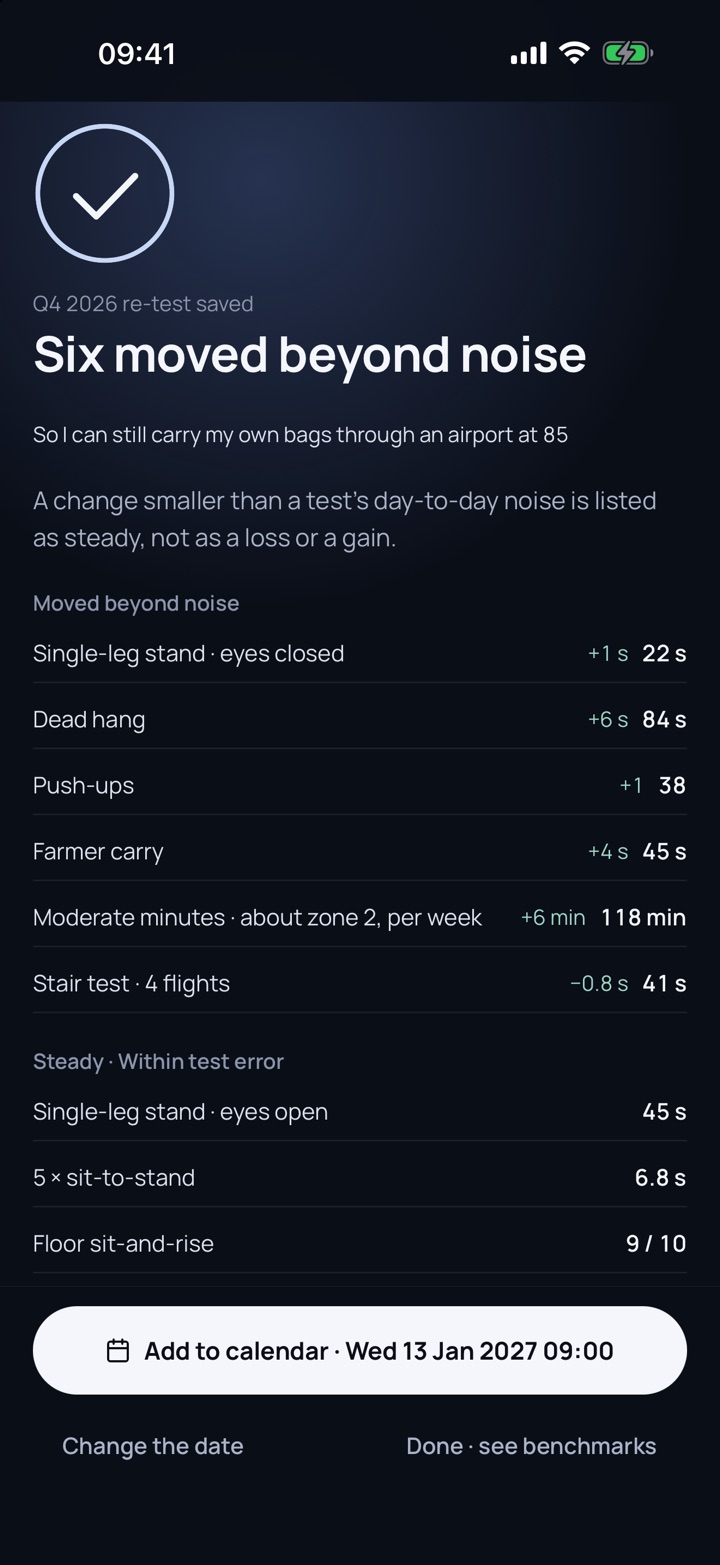
Session done
What moved, what held, and the next date.
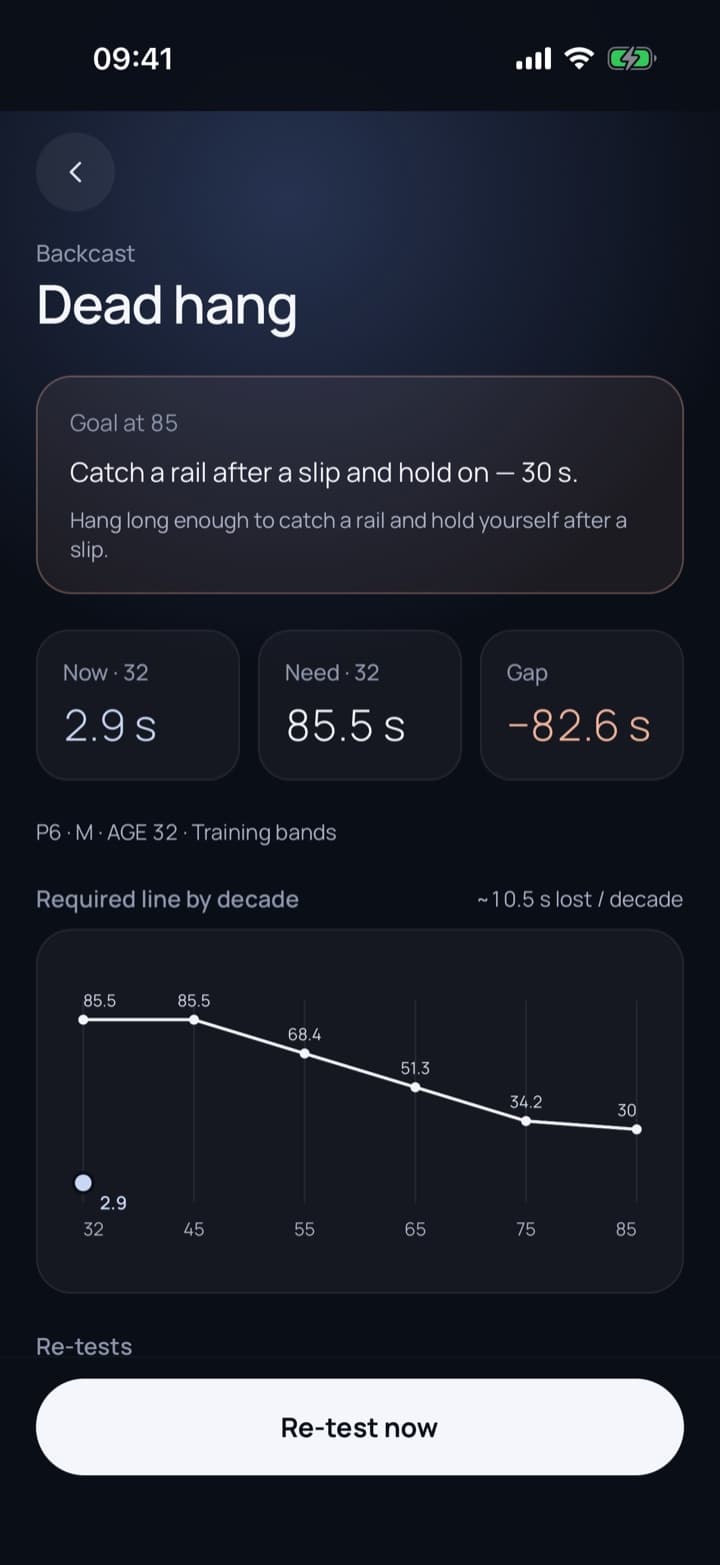
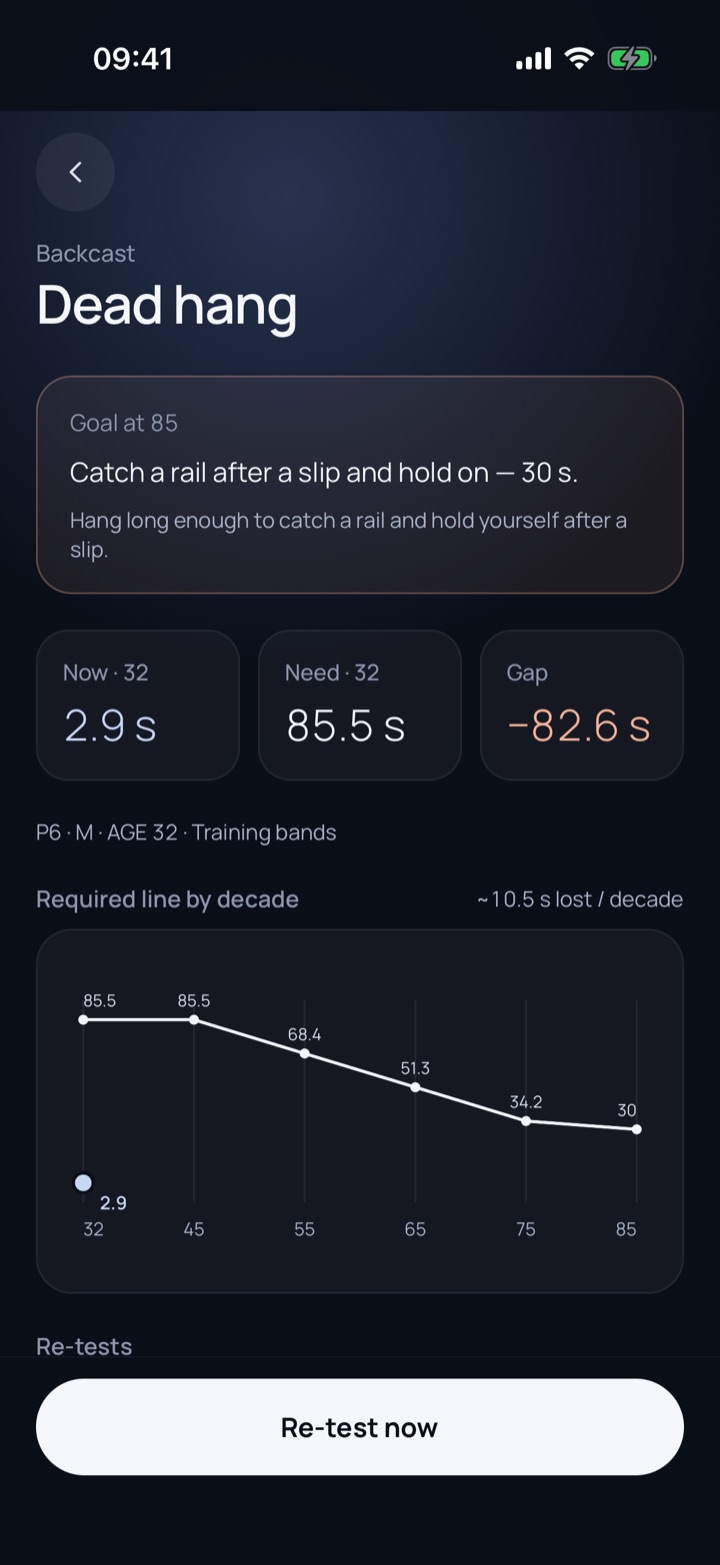
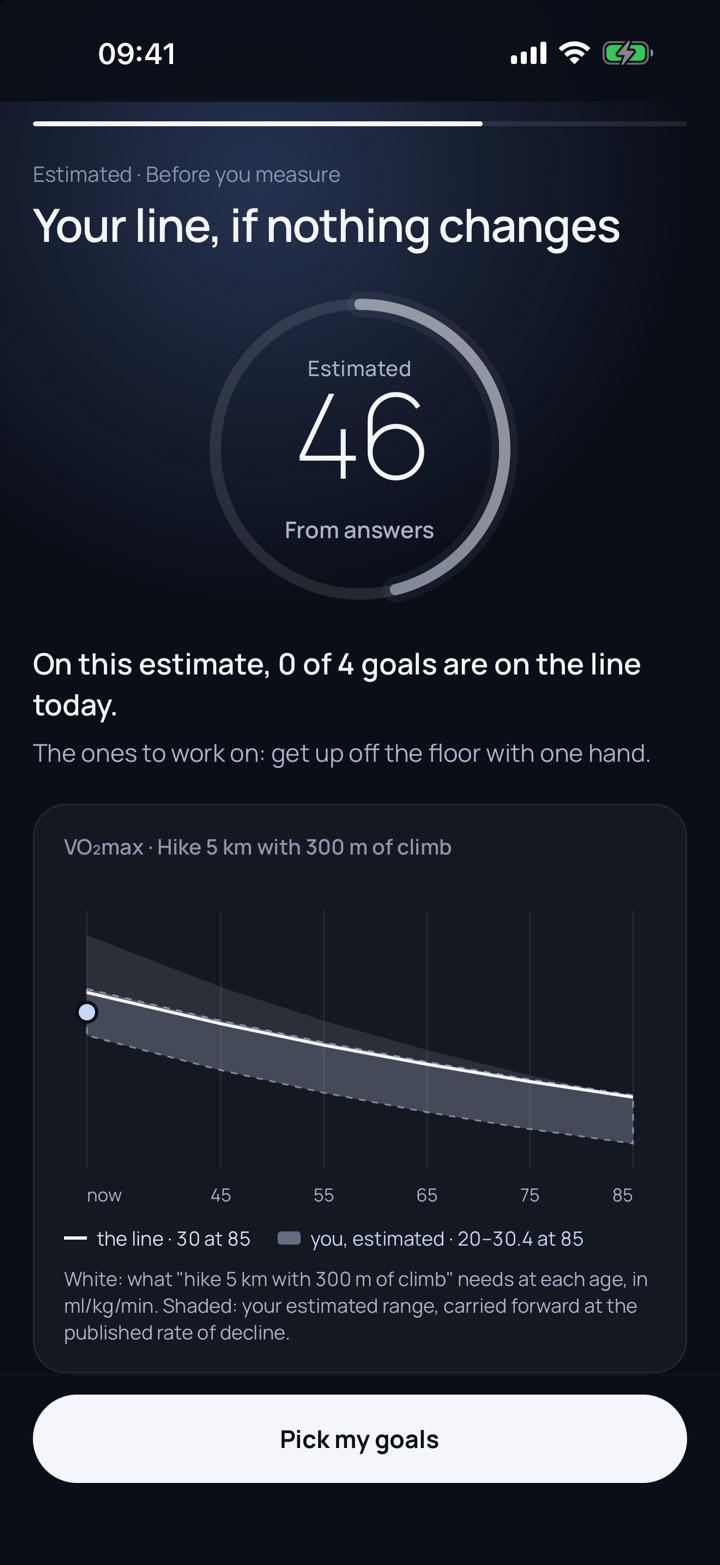
Backcast
Where you need to be at every age.
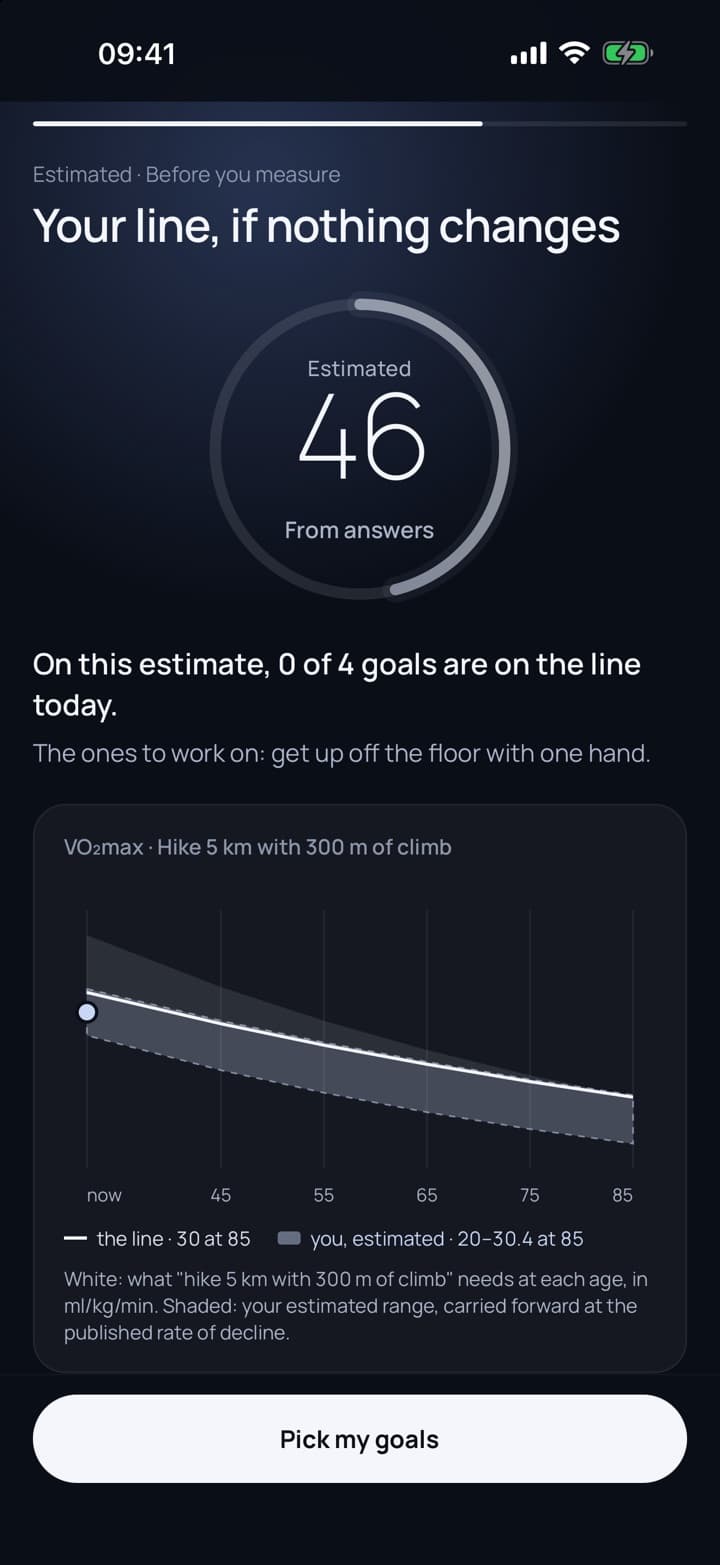
Estimated preview
Six questions before the first test. Labelled estimated.
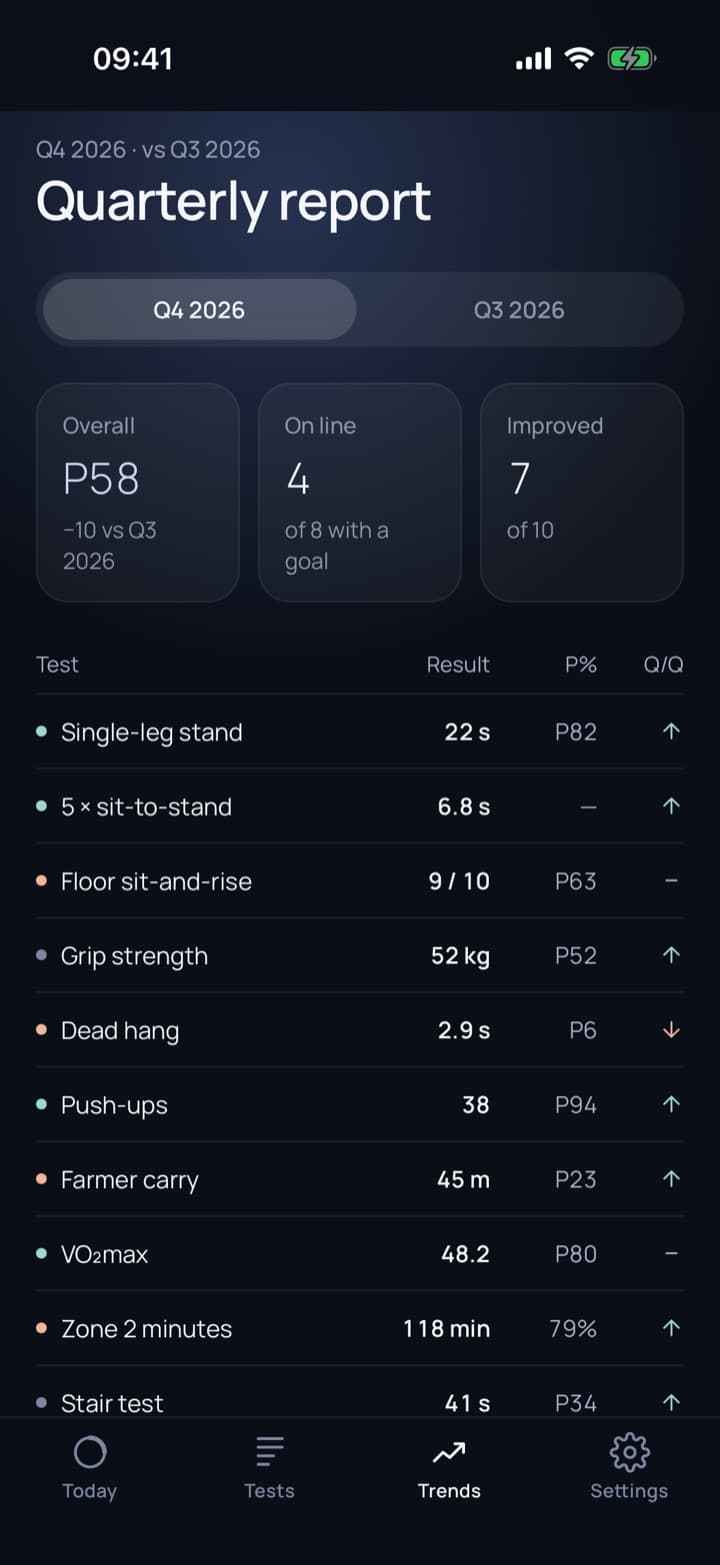
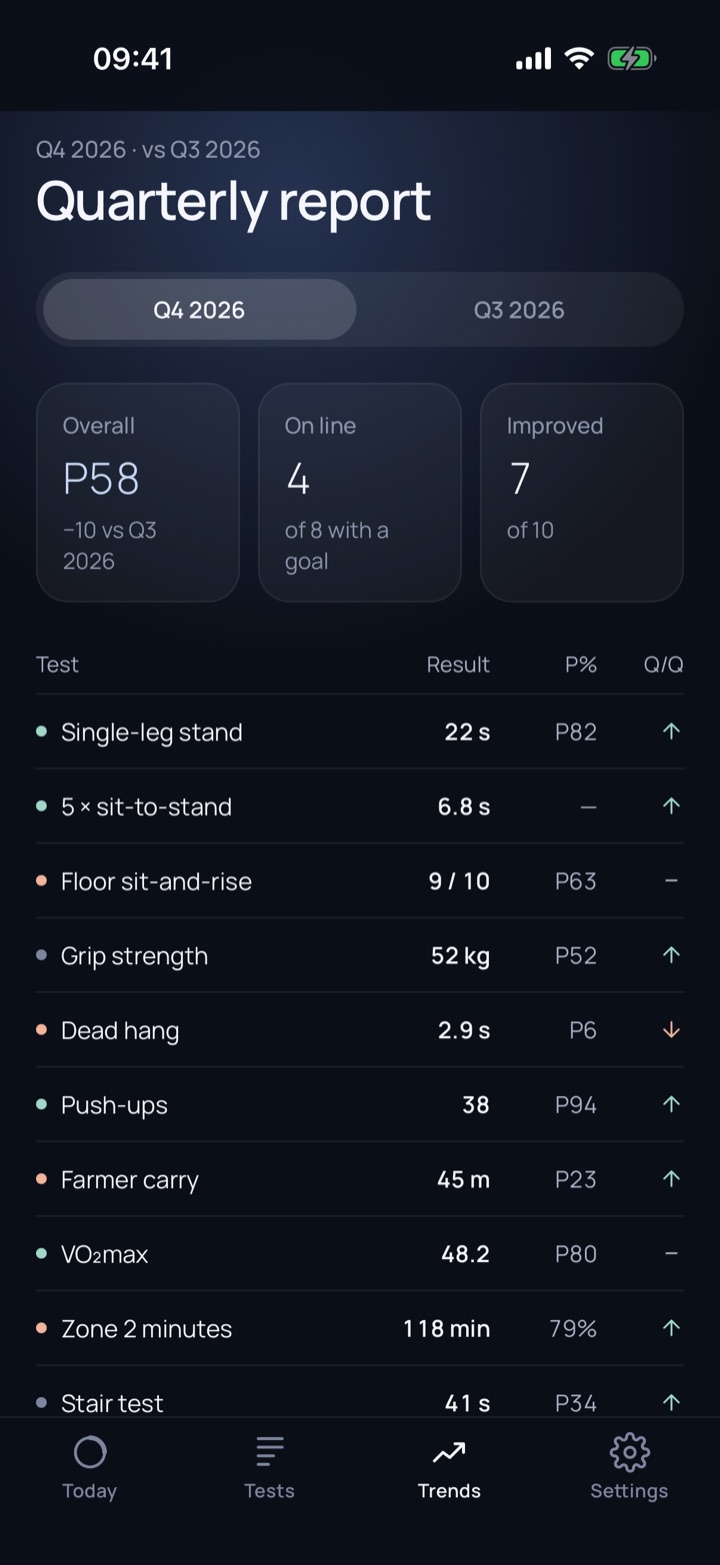
Quarterly report
Every test against last quarter.
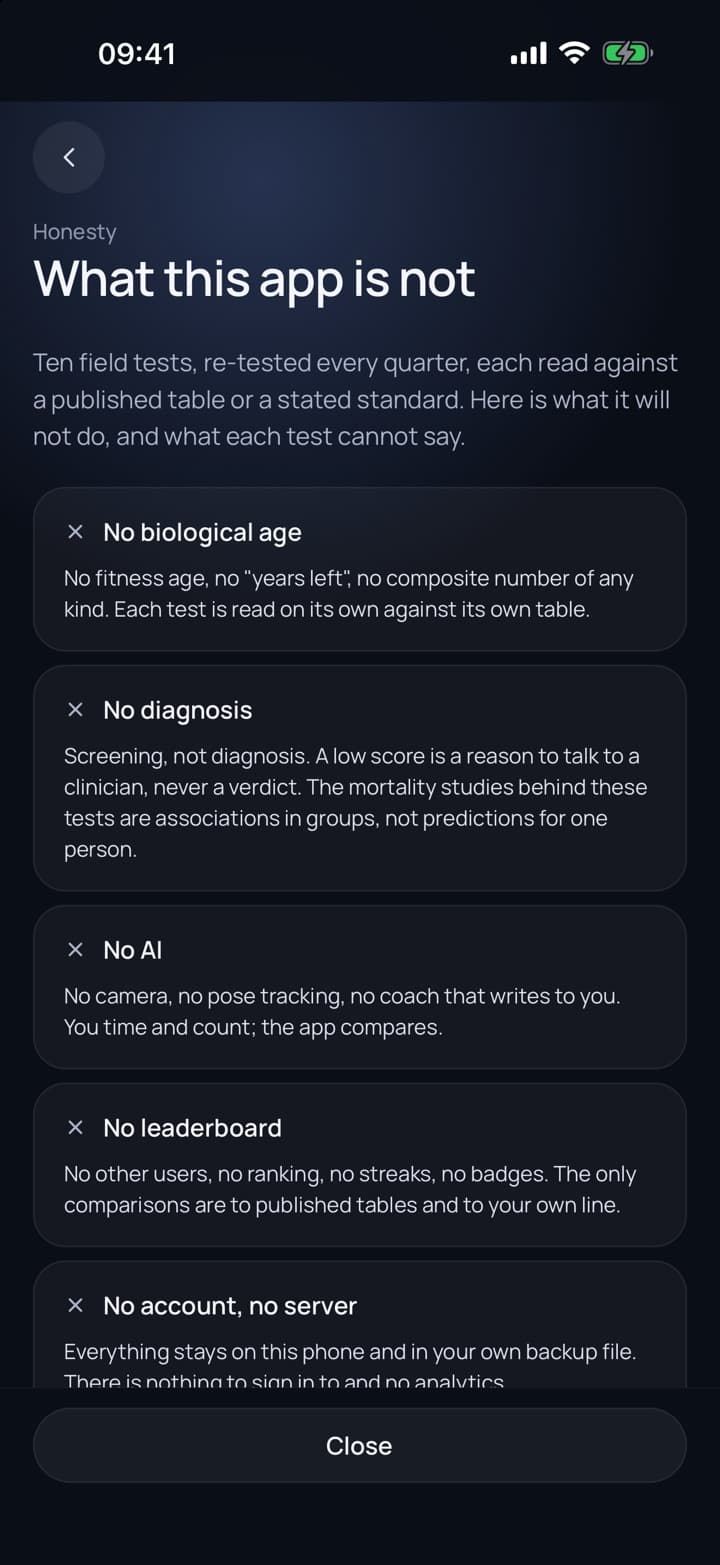
What it is not
The limits, in the app itself.

One price
After the baseline, once.
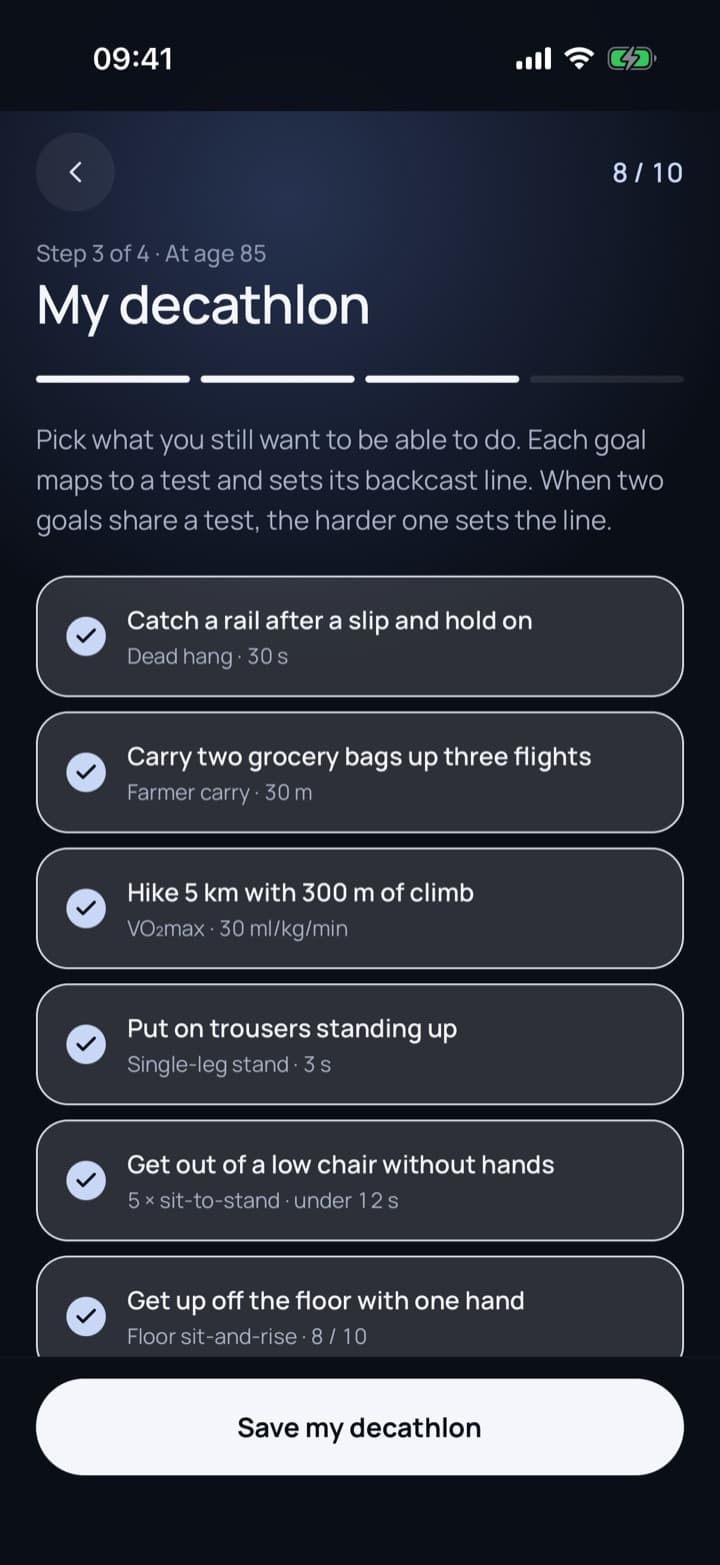
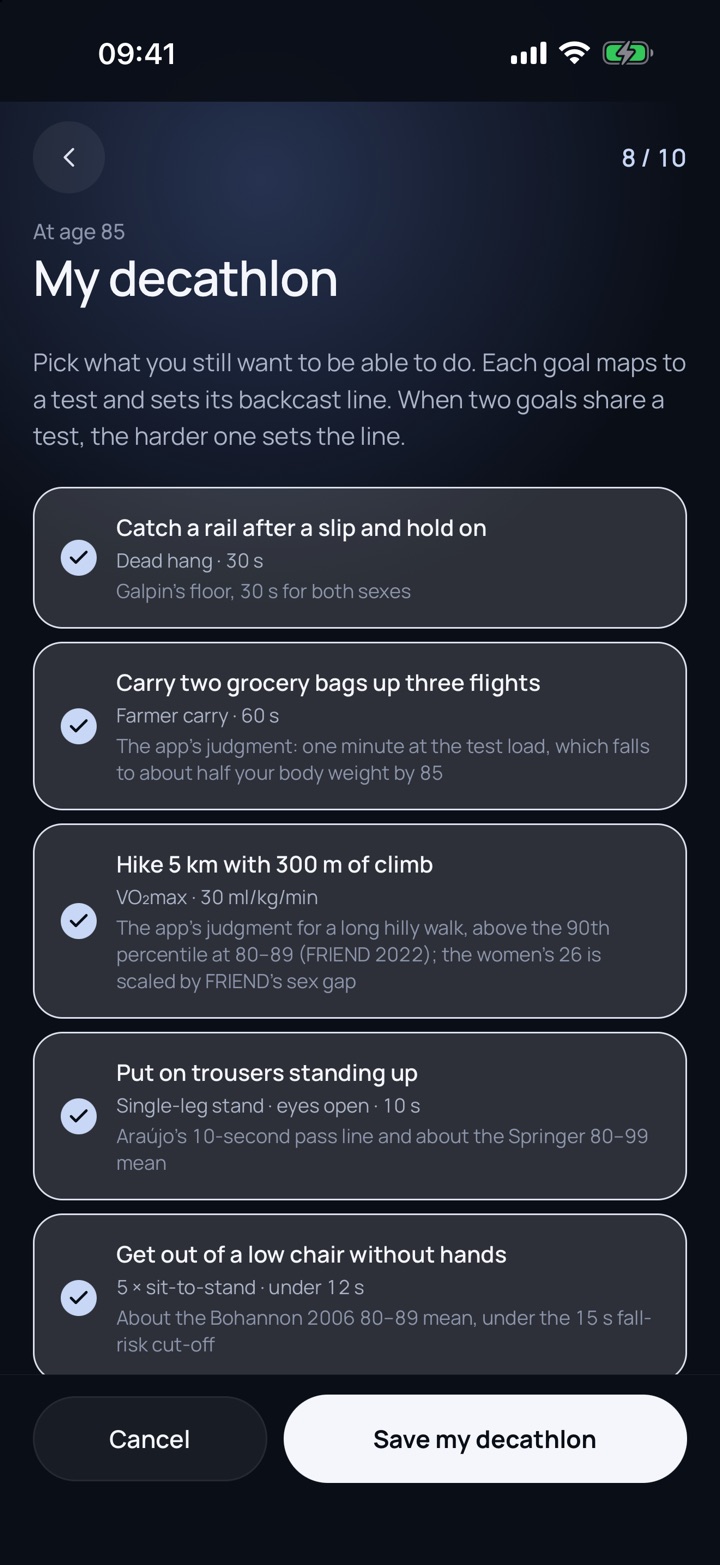
Goals at 85
Sixteen goals. Each names whose number its target is.
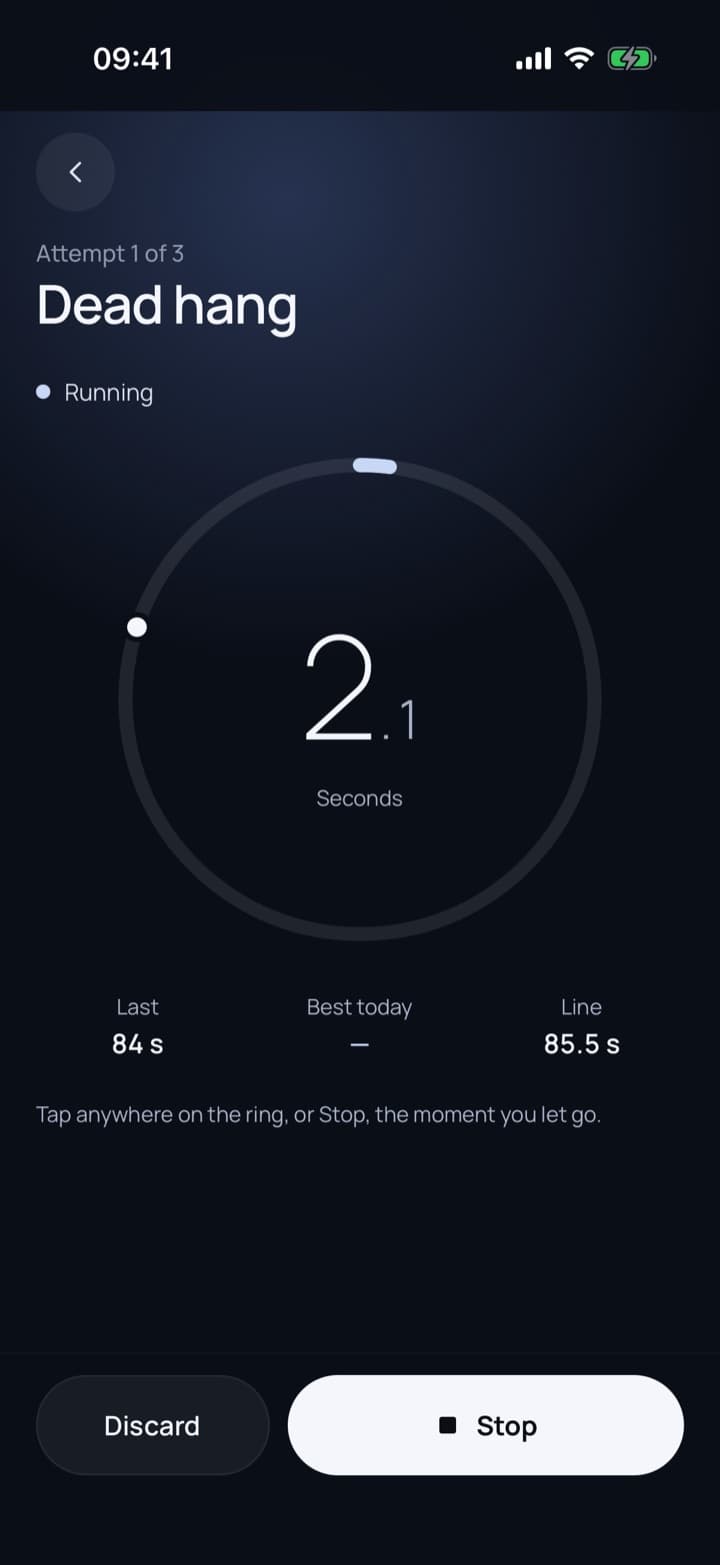
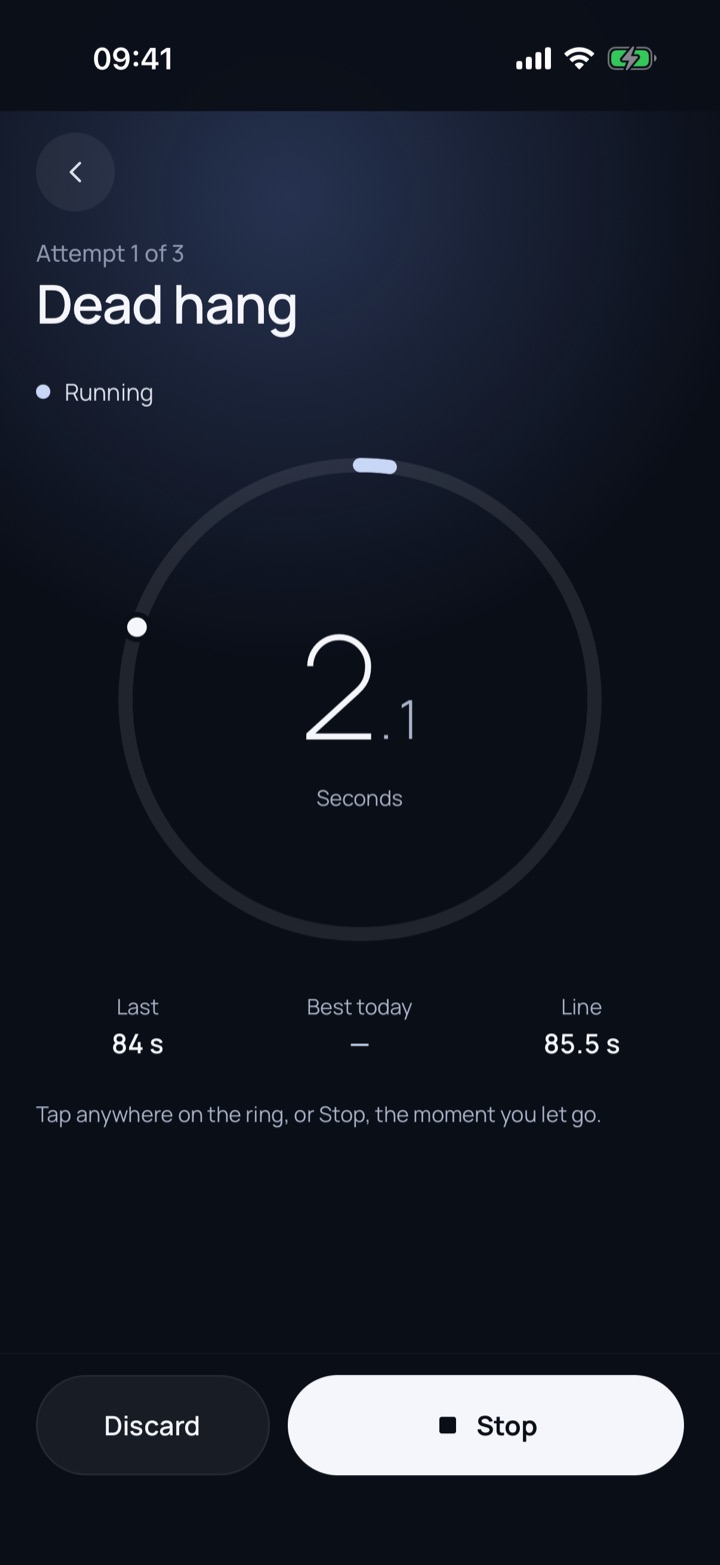
Timer
Tap the ring to stop. Made for sweaty hands.
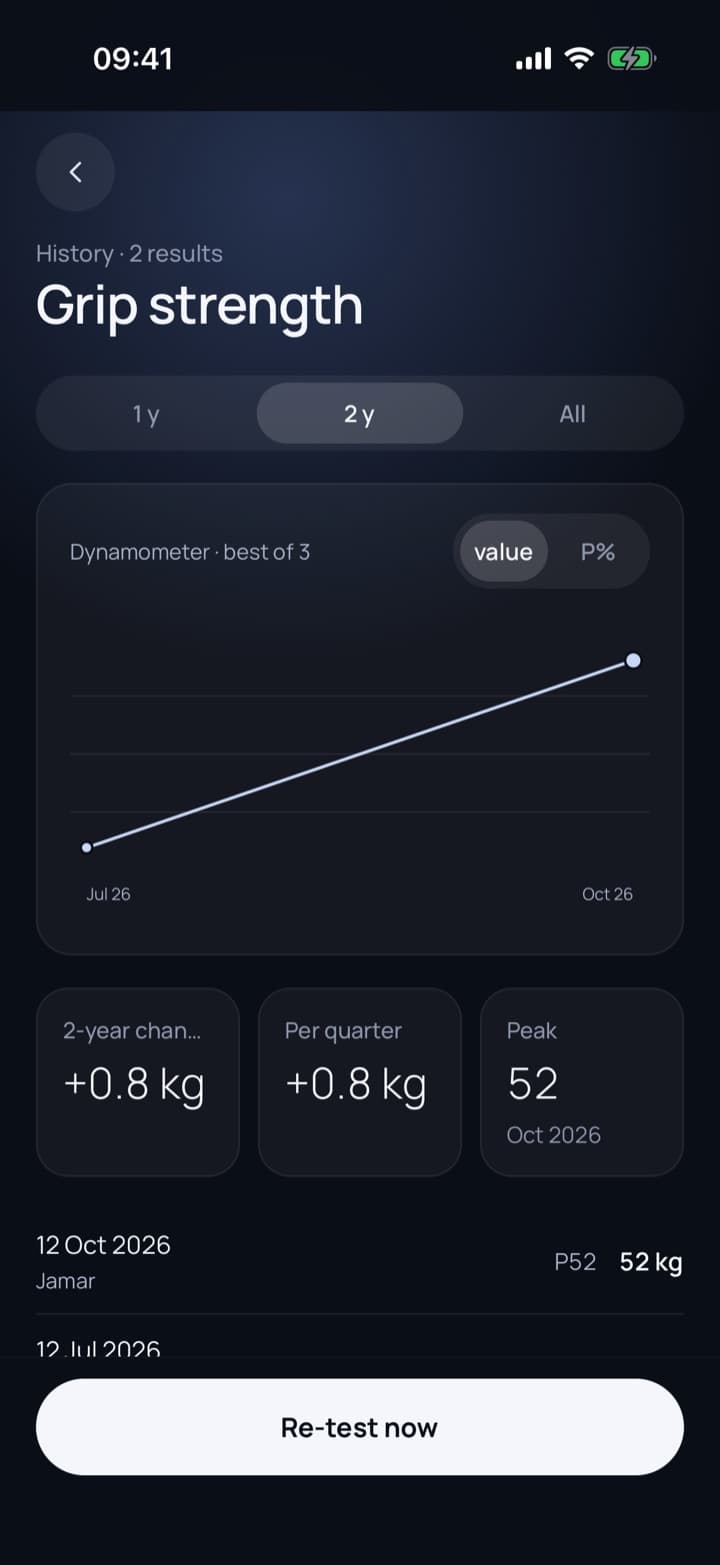
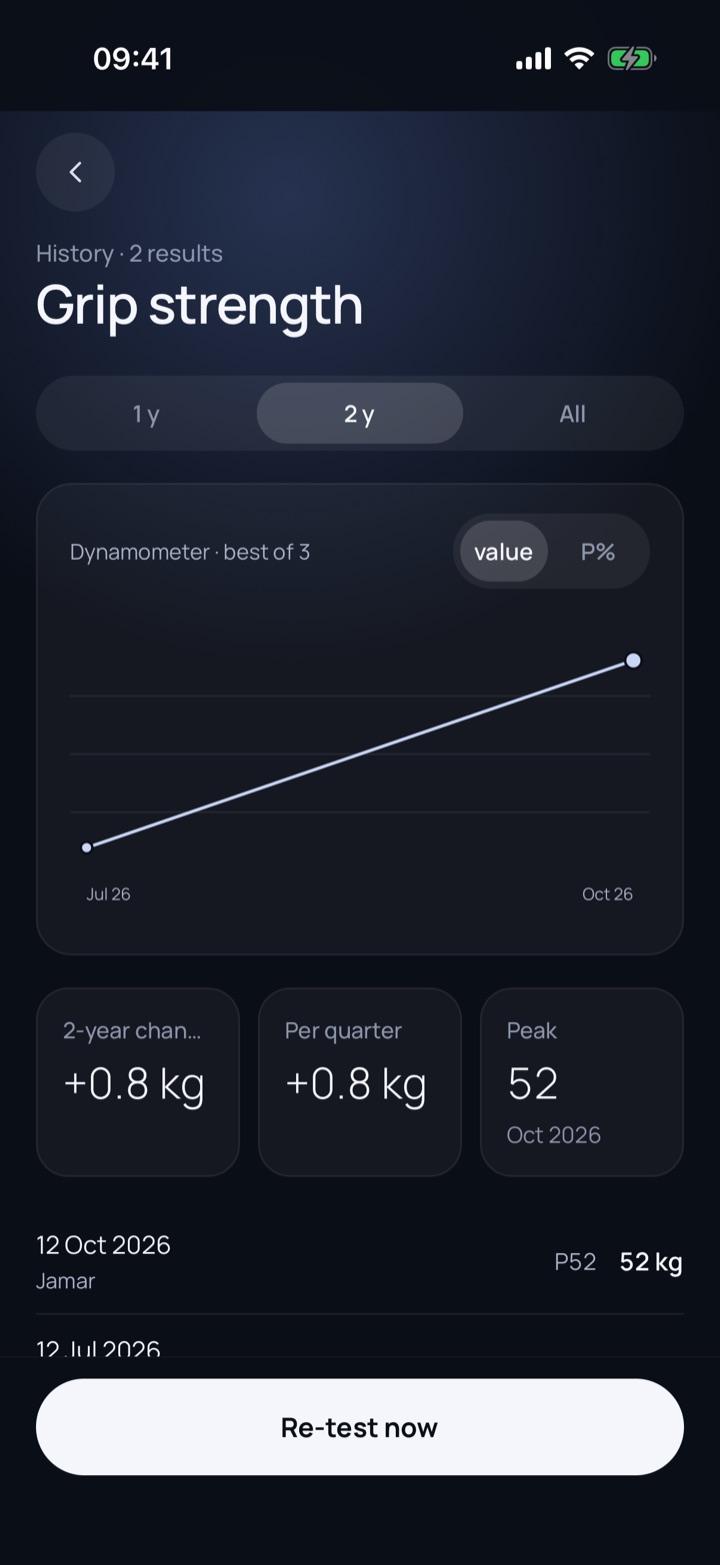
History
Your own trend, not the population curve.
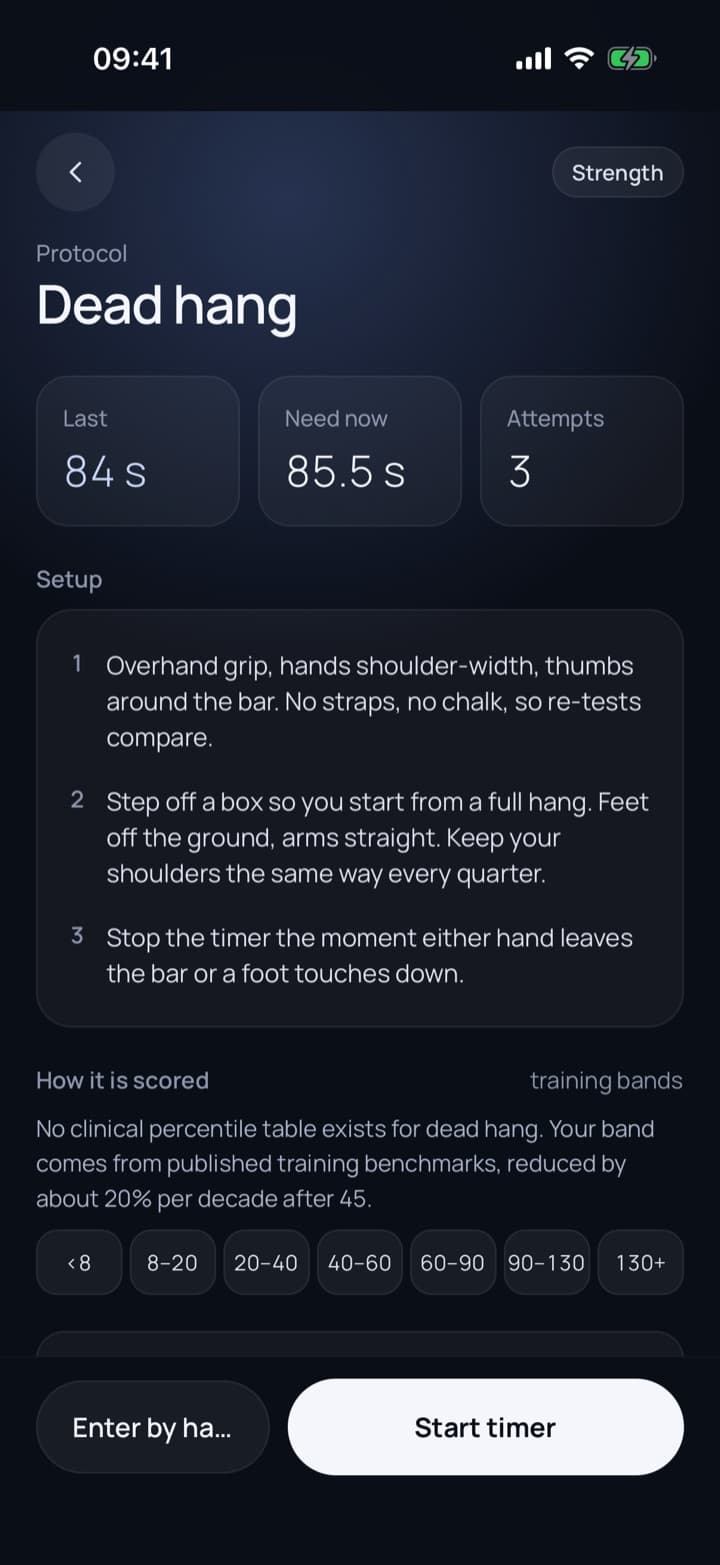
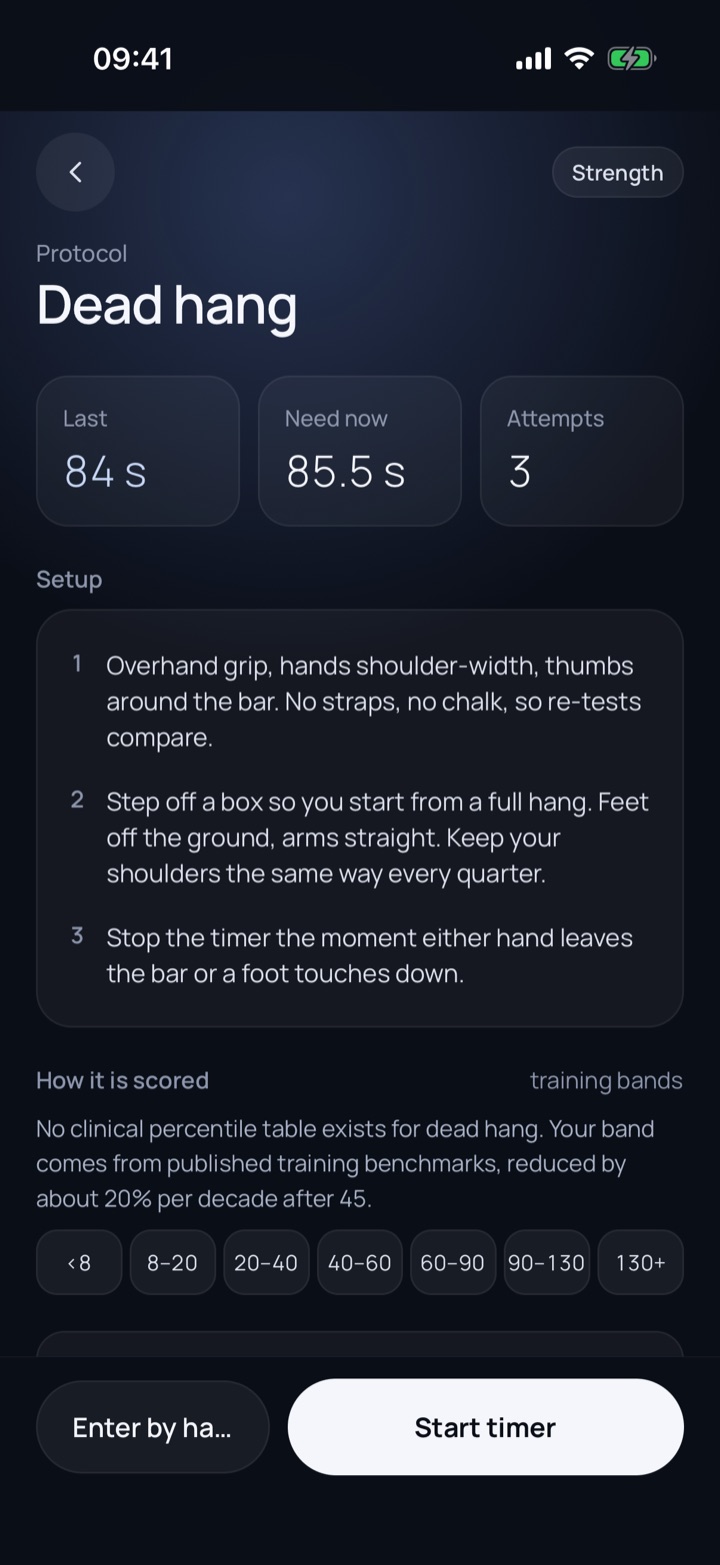
Protocol
The same steps every quarter.
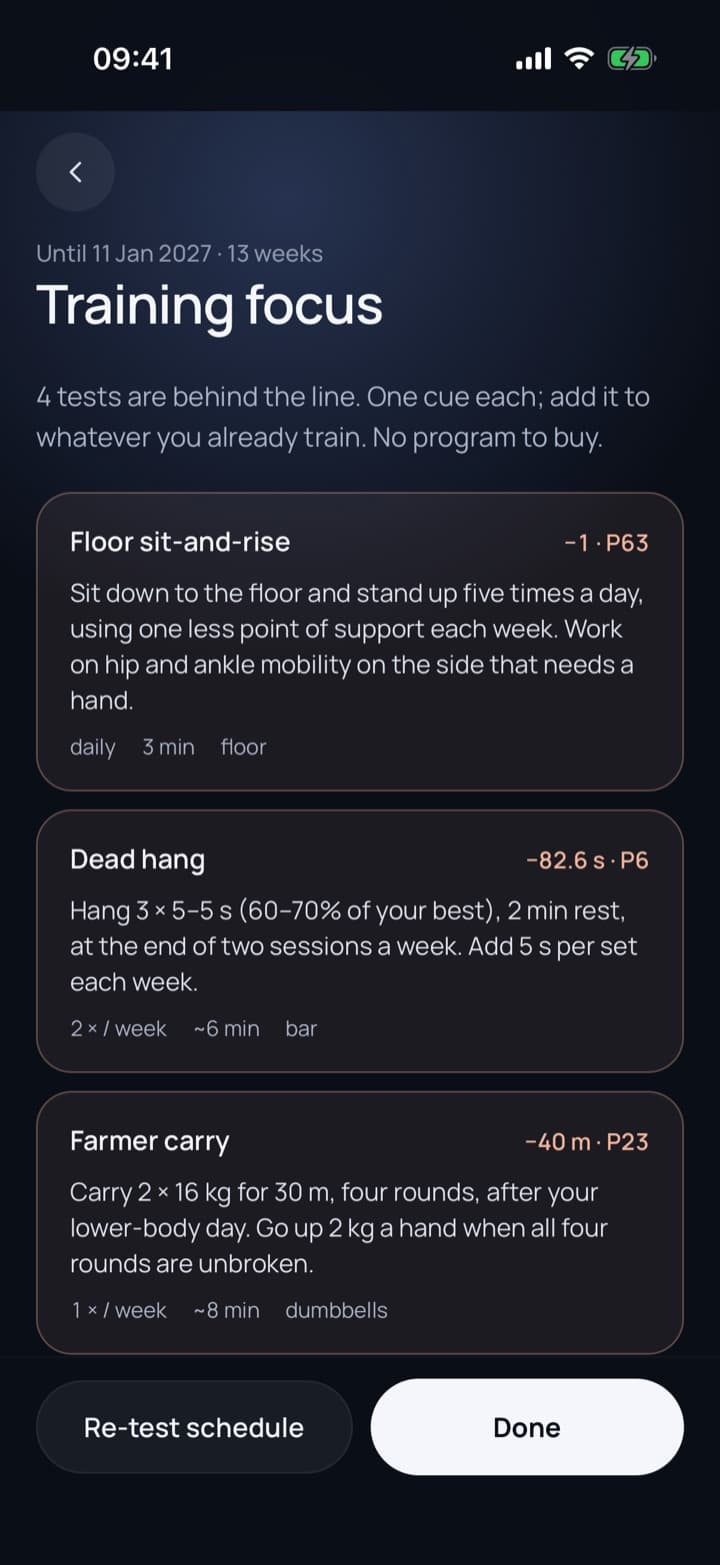
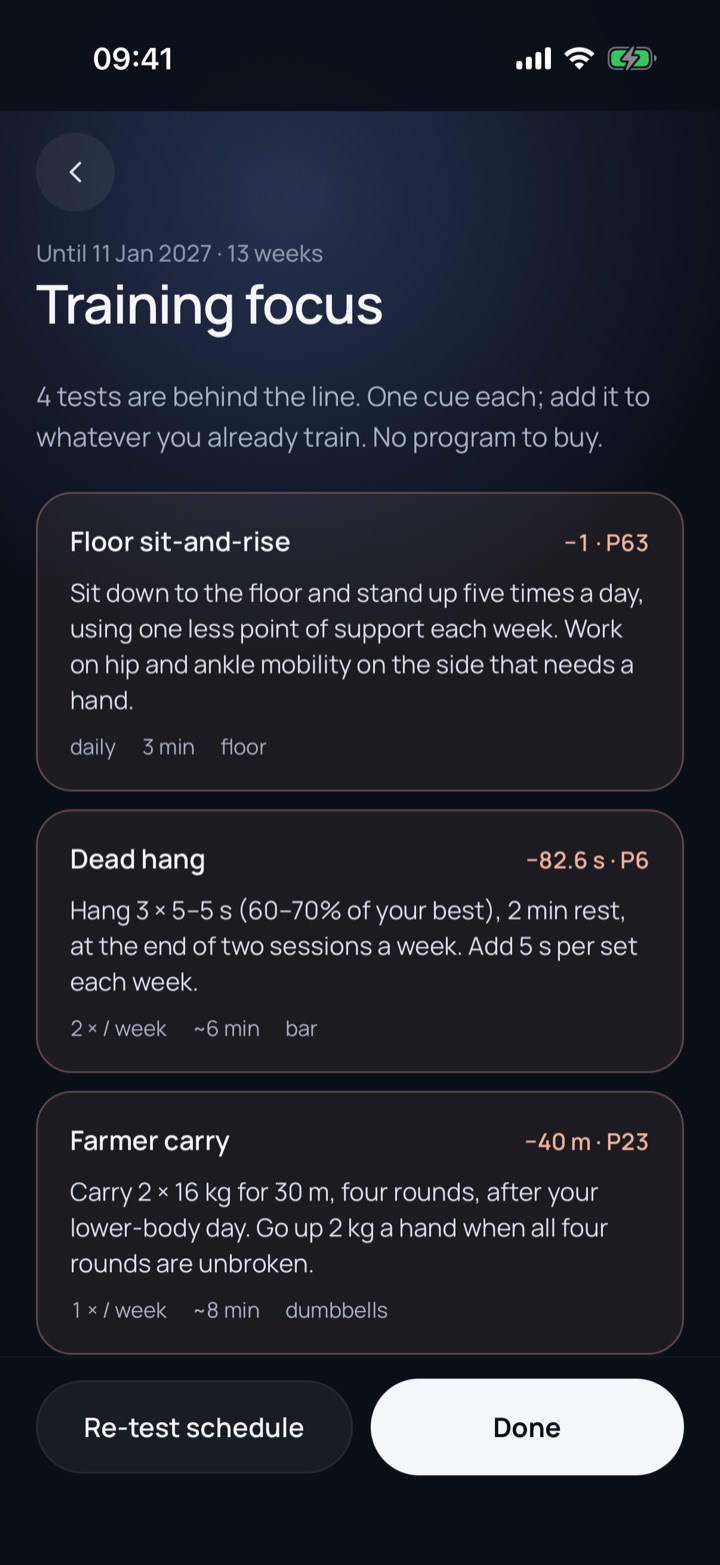
Training focus
One cue per gap. No program to buy.

Getting in touch
Press questions go to renato@bulholabs.com. The science behind every test, with what each study does not show, is on the science pages.